Showing posts with label dataset. Show all posts

Sunday, December 22, 2013

2.4 Modifying data in R

Modifying data in R

The R console has a simple tool called Data Editor to review and modify an important data file.

The data editor

The data editor opens by clicking on Edit in the window of the R console: Edit-> Data Editor. The window appears that asks about which dataframe and matrix to open. Here you type in the name of the matrix and confirming this by clicking OK. Figure 18 shows that the variable/matrix Projects is typed in for review.

Figure 18: Selecting a variable in the Data Editor of R
After choosing a variable/matrix to modify, the data appears in the form of a spreadsheet. Here you can modify different cells. If you click at the top of the spreadsheet, the window Variable Editor appears. Here you can choose between to data types: Numeric (values of the variable should be interpreted as numbers) and Character (values of the variable should be interpreted as categories). Figure 19 shows that the variable Customer satisfaction (TevredenheidKlant) is interpreted as character. You can change this by selecting numeric.

Figure 19: Variable editor of R, interpreting values of variables as numeric or character
Figure 19: Variable editor of R, interpreting values of variables as numeric or character

2.3 Importing and making a matrix of a dataset

Importing and making a matrix of the dataset


Reviewing the previous steps

In the previous steps of this tutorial you learned how to set the working directory, how to convert to a .csv-file and how to check your dataset. By executing these steps you are ready to import the dataset into the R console.

Figure 17: Making a matrix of the imported dataset

Importing the dataset

In the example of Figure 17 the dataset Projects.csv is imported. This is executed by the code read.csv('Projects.csv').

Making a variable of the dataset

Making a importing and making a variable of the dataset could also be done by one command, in case of calling the variable of the dataset Projects use the following command: Projects<-read.csv('Projects.csv'). The dataset is now attached to the variable called Projects. 

Making a matrix of the dataset

To make a matrix of the dataset, use the command attach(*name of the variable*). 
In the example of Figure 17 a matrix is created for the variable Projects with the code attach(Projects). To give an overview of the matrix of the dataset you can make R present a summary by using the command summary(*name of the variable*). In the example a summary is presented of the dataset Projects.csv. with the variable Projects by using the command summary(Projects).

To the next step: Modifying data in R

Saturday, December 21, 2013

1.2 Preparing the dataset for usage with R

Checking the data set


Data files come in different shapes and sizes. In the introduction to this manual it is
demonstrated how to convert an .xls file to a csv file. R may, without the right packages installed, not be able to read.xls files. R is always able to read .csv files.

Four criteria to check the data set

It is also important to check the content of the .xls file or .csv file to determine if the data set
is well suited to perform analysis on. In order to determine whether the data is of good
quality, the following four criteria could be used:

Accuracy:

Control of the correctness and reliability of the data set.

Timeliness:

Control if the data is up-to-date or if it is about the right period of time.

Completeness:

Check if there is data missing and check if the data set is voluminous enough to perform analysis on.

Consistency:

Check if the data uses the same values and terms over different data sets and data sources.


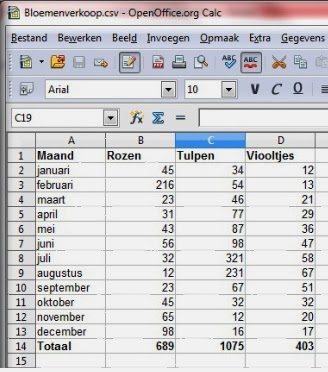
Figure 5: Example of a simple data set for analysis with R
Figure 5: Simple dataset for analysis with R

Transformation

To analyze a data file with R, it is recommended organize the file as simple and easy as possible. All kinds of text, colors or images should be removed removed from the file if you want to make the analysis go smoothly. This will avoid potential errors or other nasty complications in R. Figure 3 shows an example of the simple file Flowersales.csv. The file has been converted from .xls file to a .csv file in the previous section.

Remarks:

  1. To make R competable to read different types of files, different packages could be installed. At the page packages of this tutorial you learn how to install packages. For the actions with R performed in this manual it is not required to install packages.
  2. Important! In the page you could see that the data set contains the totals of the different flowers. R reads the first row of the csv-file as catagories (in this case Months, Roses, Tullips and Violets) and the other rows as the data about these catagories. R does not recognize the row Total. R some kind of thinks that Total is a thirteenth month. So I recommend to remove the row containing the totals of the catagories. By doing this you won't perceive problems during analyzing. R is able to calculate the totals by itself if by inserting commands in the R console.